Tahukah Anda dengan istilah "seeing" atau sering diterjemahkan dengan istilah penampakan. Istilah ini sering membingungkan orang awam karena kata penampakan sering digunakan untuk konteks lainnya. Dalam astronomi, seeing (atau penampakan) merupakan ukuran baik tidaknya kondisi langit (tepatnya atmosfer) untuk mendapatkan hasil pengamatan yang baik. Seeing yang jelek terjadi jika atmosfer sedang dalam kondisi bergejolak. Hal ini akan membuat bintang nampak berkelap kelip dan akan nampak buram ketika difoto. Tentunya hal ini akan mengganggu pengamatan oleh astronom. Penjelasan lebih lengkapnya diberikan di bawah ini.
Introduction
An observer, be they at a mountain top observatory, or in their own back yard must, at all times contend with the Earth’s atmosphere. It is a notoriously unpredictable and limiting factor in obtaining fine views of the Planets, and close binary stars. Many often comment, especially here in the UK that seeing is all too often mediocre on most nights, but what are the factors that contribute to this?. Are there ways and signs, which indicate whether the atmosphere, will be stable or turbulent on a given night?.
What is Seeing?
So what exactly is atmospheric seeing? - it is high frequency temperature fluctuations of the atmosphere, and the mixing of air “parcels” of different temperatures/densities. This behaviour of the atmosphere is seen at the eyepiece as a blurred, moving, or scintillating image. There are roughly 3 main areas where Atmospheric turbulence occurs. Near ground seeing (0 – 100metres or so.) central troposphere (100m – 2km), and High troposphere (6-12km.) Each area exhibits different characteristics, which are explained in more detail below.
- Lower Altitude Effects: The air near the ground is where the great majority of turbulent airflow of the atmosphere occurs, which of course happens to be the area where the great majority of amateur observers are located!. This is caused mainly by areas (houses, other building etc) of varying density radiating heat differently, resulting in local convection currents. This is caused when the Sun heats the ground during the day, and the heat is then radiated away at night. An un-varying topography, such as grassy fields, and large bodies of water are favourable to observe over, at they radiate the stored heat from the day more slowly and equally. Also the telescope itself can perturb the image, if it hasn’t reached ambient temperature, this will result in a “boiling effect” when viewing. One should leave their scope for at least 1 hr prior to observing and probably longer. Also certain types of telescope and observatory are more prone to turbulence. Newtonian reflectors can be troublesome if not properly ventilated, as can Schmidt Cassegrain’s if not left to cool for long enough. As for observatories, Domes have poorer characteristics for stable seeing than run of roof designs.
- Mid- Altitude Effects: The turbulence at these altitudes is determined largely by the topography upwind of the observing site. Hence again, living downwind of a large city, or densely populated area, mountain range or other very varied topography will perturb the atmosphere. Downwind of a mountain peak will disrupt the airflow into turbulent eddies, resulting in scintillating images. This effect can prevail as far as 100km downwind of the peak. In this aspect, it is best to observe where the prevailing winds across your site have travelled over an unvarying terrain (large body of water or hills/fields for many miles upwind of the site.) This will help produce a laminar flow, and stable images.
- High Altitude Effects: Effects at this altitude are caused by fast moving “rivers” of air know as Jet streams. Wind shears at around the 200-300mb altitude level can cause images to appear stable, but very fuzzy, and devoid of fine detail. There isn’t anything the observer can do to prevent these effects, but forecasts are available, to help predict weather a Jet stream is present over your area. Areas of the Northern hemisphere most affected by the Polar jet stream are the Central US, Canada, North Africa, and Northern Japan. The Jet stream’s position varies with the seasons, tending to move further South during the winter and spring months.
The best locations for good seeing
The world’s finest locations for a stable atmosphere are mountain top observatories, located above frequently occurring temperature inversion layers, where the prevailing winds have crossed many miles of ocean. Sites such as these (La Palma, Tenerife, Hawaii, Paranal etc) frequently enjoy superb seeing much of the year, (with measured turbulence as low as 0.11” arc seconds occurring at times) due to a laminar flow off the ocean. Sea level locations, on shorelines, where the prevailing winds have crossed many miles of ocean (Florida, Caribbean Islands, Canary Islands etc) can be almost as good, and generally very consistent and stable conditions prevail there. Also a major factor is generally unvarying weather patterns, dominated by large anti-cyclones (High pressure systems.) Areas outside these large high-pressure systems have more variable weather, and are more prone to a more variable state of atmospheric stability.
Other, less well know locations where excellent stability prevails are the Island of Madeira’s highest point (Encumeada Alta, 1800m) where seeing is better than 1” arc second 50% of the time. At Mount Maidanak (Uzbekistan, 2600m) the median seeing value observed from 1996-2000 was just 0.69” arc seconds, presenting a site with properties almost as good as Paranal and La Palma.
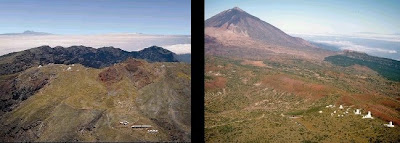 Figure 01: Above are the observatories (Left) Roque De Los Muchachos on La Palma, and (Right) Observatorio del Teide on Tenerife. Both are located at 2400m above sea level, and are among the worlds finest observing locations. Measured turbulence values at these locations is better than 1” arc second a staggering 80% of the year. (Courtesy ENO.)
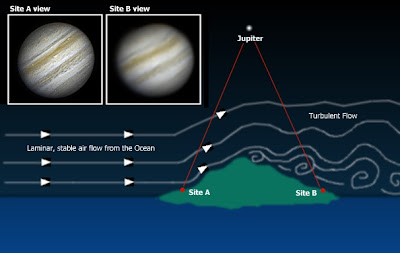 Figure 02: Above is a diagram showing how mountains break up stable airflow into turbulence. Note the difference in the probable views from site A (facing into the prevailing winds off the ocean) and site B (Located on the downwind side of the mountain peaks.)
Predicting your local seeing
So is it possible to predict Atmospheric seeing with any accuracy?. The answer to this is yes, most of the time. For example poor seeing will almost always occur after a cold front has passed over, replacing the warmer air, with cooler air, which often gives rise to local convection, and turbulent skies. However, preceding a cold front the air is warmer, and more stable. This is especially true when a large High-pressure system has been present, and mist or fog forms. At these times, transparency can be reduced, but seeing can be excellent. It is also my experience that strong winds are often associated with poor seeing. Another thing to look out for is what type of clouds are present. Lots of cumulus forming in the afternoon due to convection will probably mean seeing will be poor for several hours after sunset. However if the winds are light, and high altitude cirrus shows a smooth linear pattern, this often indicates that the seeing will be good. It was also once thought that maritime locations were far from optimal for good seeing conditions, but as we have seen earlier in the article this is often far from the case.
An even easier way to quickly gauge if a given night will present fine telescopic views is to simply see how much the stars are twinkling. If they twinkle little, and slowly, it probably indicates seeing conditions are reasonably good. However, if they are twinkling madly its probably a sign the views will be poor. This basic method does work quite well, but isn’t 100% accurate. Nights when fast, high altitude turbulence prevails will not show itself as noticeable twinkling, and one must simply look through their telescope to see what’s happening.
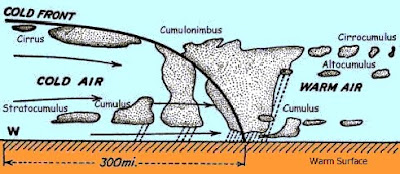 Figure 03: Above is a diagram showing a cold front, and associated air masses. The air preceding the front is older, and warmer, and generally quite stable as the ground/air temperature difference is small. However, after the front passes, the warmer air is replaced by cooler air, resulting in significant local convection causing turbulence. Seeing wont improve until the ground/air temperatures again equalize – this usually takes several hours.
A scale of seeing
Many scales have been devised to rate how steady the atmosphere is on a given night. Below is one of the most popular in use, and one I personally use. This scale of seeing is the Pickering Scale, devised by Harvard Observatory's William H. Pickering (1858-1938). Pickering used a 5-inch refractor to devise the scale. His comments about diffraction patterns will have to be modified for larger or smaller instruments. A good starting point:
p1. Star image is usually about twice the diameter of the third diffraction ring if the ring could be seen; star image 13" in diameter.
p2. Image occasionally twice the diameter of the third ring (13").
p3. Image about the same diameter as the third ring (6.7"), and brighter at the centre.
p4. The central Airy diffraction disk often visible; arcs of diffraction rings sometimes seen on brighter stars.
p5. Airy disk always visible; arcs frequently seen on brighter stars.
p6. Airy disk always visible; short arcs constantly seen.
p7. Disk sometimes sharply defined; diffraction rings seen as long arcs or complete circles.
p8. Disk always sharply defined rings seen as long arcs or complete circles, but always in motion.
p9. The inner diffraction ring is stationary. Outer rings momentarily stationary.
p10. The complete diffraction pattern is stationary.
Note: On this scale 1-2 is very poor, 3-4 is poor, 5 is fair, 6-7 is good, 7-8 very good, and 8-10 excellent.
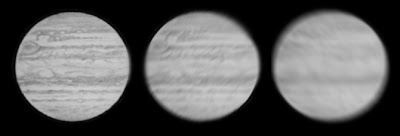 Fig 04. A drawing of Jupiter by the author, simulated to show 3 different views as a high quality 25 cm reflector would show the Planet at powers of 350x. (far left) under excellent seeing, (centre) under fair seeing, and (far right) very poor seeing.
Source: The Atmosphere and Observing by Damien Peach


