Wednesday, December 16, 2009

Astrofotografi - The Atmosphere and Observing

Tahukah Anda dengan istilah "seeing" atau sering diterjemahkan dengan istilah penampakan. Istilah ini sering membingungkan orang awam karena kata penampakan sering digunakan untuk konteks lainnya. Dalam astronomi, seeing (atau penampakan) merupakan ukuran baik tidaknya kondisi langit (tepatnya atmosfer) untuk mendapatkan hasil pengamatan yang baik. Seeing yang jelek terjadi jika atmosfer sedang dalam kondisi bergejolak. Hal ini akan membuat bintang nampak berkelap kelip dan akan nampak buram ketika difoto. Tentunya hal ini akan mengganggu pengamatan oleh astronom. Penjelasan lebih lengkapnya diberikan di bawah ini.

Introduction
An observer, be they at a mountain top observatory, or in their own back yard must, at all times contend with the Earth’s atmosphere. It is a notoriously unpredictable and limiting factor in obtaining fine views of the Planets, and close binary stars. Many often comment, especially here in the UK that seeing is all too often mediocre on most nights, but what are the factors that contribute to this?. Are there ways and signs, which indicate whether the atmosphere, will be stable or turbulent on a given night?.

What is Seeing?
So what exactly is atmospheric seeing? - it is high frequency temperature fluctuations of the atmosphere, and the mixing of air “parcels” of different temperatures/densities. This behaviour of the atmosphere is seen at the eyepiece as a blurred, moving, or scintillating image. There are roughly 3 main areas where Atmospheric turbulence occurs. Near ground seeing (0 – 100metres or so.) central troposphere (100m – 2km), and High troposphere (6-12km.) Each area exhibits different characteristics, which are explained in more detail below.
  • Lower Altitude Effects: The air near the ground is where the great majority of turbulent airflow of the atmosphere occurs, which of course happens to be the area where the great majority of amateur observers are located!. This is caused mainly by areas (houses, other building etc) of varying density radiating heat differently, resulting in local convection currents. This is caused when the Sun heats the ground during the day, and the heat is then radiated away at night. An un-varying topography, such as grassy fields, and large bodies of water are favourable to observe over, at they radiate the stored heat from the day more slowly and equally. Also the telescope itself can perturb the image, if it hasn’t reached ambient temperature, this will result in a “boiling effect” when viewing. One should leave their scope for at least 1 hr prior to observing and probably longer. Also certain types of telescope and observatory are more prone to turbulence. Newtonian reflectors can be troublesome if not properly ventilated, as can Schmidt Cassegrain’s if not left to cool for long enough. As for observatories, Domes have poorer characteristics for stable seeing than run of roof designs.
  • Mid- Altitude Effects: The turbulence at these altitudes is determined largely by the topography upwind of the observing site. Hence again, living downwind of a large city, or densely populated area, mountain range or other very varied topography will perturb the atmosphere. Downwind of a mountain peak will disrupt the airflow into turbulent eddies, resulting in scintillating images. This effect can prevail as far as 100km downwind of the peak. In this aspect, it is best to observe where the prevailing winds across your site have travelled over an unvarying terrain (large body of water or hills/fields for many miles upwind of the site.) This will help produce a laminar flow, and stable images.
  • High Altitude Effects: Effects at this altitude are caused by fast moving “rivers” of air know as Jet streams. Wind shears at around the 200-300mb altitude level can cause images to appear stable, but very fuzzy, and devoid of fine detail. There isn’t anything the observer can do to prevent these effects, but forecasts are available, to help predict weather a Jet stream is present over your area. Areas of the Northern hemisphere most affected by the Polar jet stream are the Central US, Canada, North Africa, and Northern Japan. The Jet stream’s position varies with the seasons, tending to move further South during the winter and spring months.
The best locations for good seeing
The world’s finest locations for a stable atmosphere are mountain top observatories, located above frequently occurring temperature inversion layers, where the prevailing winds have crossed many miles of ocean. Sites such as these (La Palma, Tenerife, Hawaii, Paranal etc) frequently enjoy superb seeing much of the year, (with measured turbulence as low as 0.11” arc seconds occurring at times) due to a laminar flow off the ocean. Sea level locations, on shorelines, where the prevailing winds have crossed many miles of ocean (Florida, Caribbean Islands, Canary Islands etc) can be almost as good, and generally very consistent and stable conditions prevail there. Also a major factor is generally unvarying weather patterns, dominated by large anti-cyclones (High pressure systems.) Areas outside these large high-pressure systems have more variable weather, and are more prone to a more variable state of atmospheric stability.

Other, less well know locations where excellent stability prevails are the Island of Madeira’s highest point (Encumeada Alta, 1800m) where seeing is better than 1” arc second 50% of the time. At Mount Maidanak (Uzbekistan, 2600m) the median seeing value observed from 1996-2000 was just 0.69” arc seconds, presenting a site with properties almost as good as Paranal and La Palma.
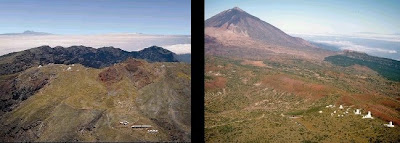
Figure 01: Above are the observatories (Left) Roque De Los Muchachos on La Palma, and (Right) Observatorio del Teide on Tenerife. Both are located at 2400m above sea level, and are among the worlds finest observing locations. Measured turbulence values at these locations is better than 1” arc second a staggering 80% of the year. (Courtesy ENO.)
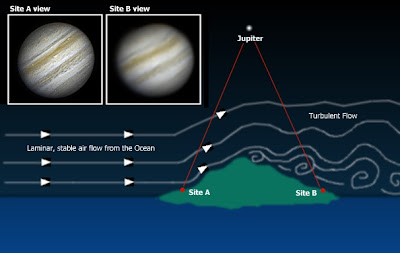
Figure 02: Above is a diagram showing how mountains break up stable airflow into turbulence. Note the difference in the probable views from site A (facing into the prevailing winds off the ocean) and site B (Located on the downwind side of the mountain peaks.)

Predicting your local seeing
So is it possible to predict Atmospheric seeing with any accuracy?. The answer to this is yes, most of the time. For example poor seeing will almost always occur after a cold front has passed over, replacing the warmer air, with cooler air, which often gives rise to local convection, and turbulent skies. However, preceding a cold front the air is warmer, and more stable. This is especially true when a large High-pressure system has been present, and mist or fog forms. At these times, transparency can be reduced, but seeing can be excellent. It is also my experience that strong winds are often associated with poor seeing. Another thing to look out for is what type of clouds are present. Lots of cumulus forming in the afternoon due to convection will probably mean seeing will be poor for several hours after sunset. However if the winds are light, and high altitude cirrus shows a smooth linear pattern, this often indicates that the seeing will be good. It was also once thought that maritime locations were far from optimal for good seeing conditions, but as we have seen earlier in the article this is often far from the case.

An even easier way to quickly gauge if a given night will present fine telescopic views is to simply see how much the stars are twinkling. If they twinkle little, and slowly, it probably indicates seeing conditions are reasonably good. However, if they are twinkling madly its probably a sign the views will be poor. This basic method does work quite well, but isn’t 100% accurate. Nights when fast, high altitude turbulence prevails will not show itself as noticeable twinkling, and one must simply look through their telescope to see what’s happening.
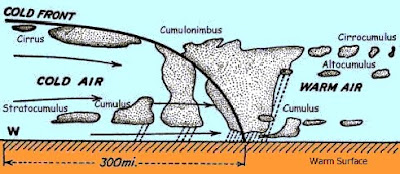
Figure 03: Above is a diagram showing a cold front, and associated air masses. The air preceding the front is older, and warmer, and generally quite stable as the ground/air temperature difference is small. However, after the front passes, the warmer air is replaced by cooler air, resulting in significant local convection causing turbulence. Seeing wont improve until the ground/air temperatures again equalize – this usually takes several hours.

A scale of seeing
Many scales have been devised to rate how steady the atmosphere is on a given night. Below is one of the most popular in use, and one I personally use. This scale of seeing is the Pickering Scale, devised by Harvard Observatory's William H. Pickering (1858-1938). Pickering used a 5-inch refractor to devise the scale. His comments about diffraction patterns will have to be modified for larger or smaller instruments. A good starting point:

p1. Star image is usually about twice the diameter of the third diffraction ring if the ring could be seen; star image 13" in diameter.

p2. Image occasionally twice the diameter of the third ring (13").

p3. Image about the same diameter as the third ring (6.7"), and brighter at the centre.

p4. The central Airy diffraction disk often visible; arcs of diffraction rings sometimes seen on brighter stars.

p5. Airy disk always visible; arcs frequently seen on brighter stars.

p6. Airy disk always visible; short arcs constantly seen.

p7. Disk sometimes sharply defined; diffraction rings seen as long arcs or complete circles.

p8. Disk always sharply defined rings seen as long arcs or complete circles, but always in motion.

p9. The inner diffraction ring is stationary. Outer rings momentarily stationary.

p10. The complete diffraction pattern is stationary.

Note: On this scale 1-2 is very poor, 3-4 is poor, 5 is fair, 6-7 is good, 7-8 very good, and 8-10 excellent.
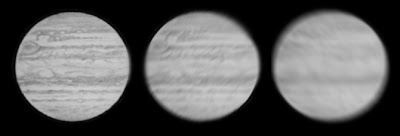
Fig 04. A drawing of Jupiter by the author, simulated to show 3 different views as a high quality 25 cm reflector would show the Planet at powers of 350x. (far left) under excellent seeing, (centre) under fair seeing, and (far right) very poor seeing.

Source: The Atmosphere and Observing by Damien Peach

Universe

Tuesday, December 15, 2009

Gerhana Bulan di Malam Tahun Baru

Malam tanggal 31 Desember 2009, akan dihiasi dengan adanya fenomena Gerhana Bulan Sebagian. Hanya sedikit piringan Bulan akan memasuki umbra Bumi sehingga permukaan Bulan purnama akan nampak sedikit redup dibandingkan biasanya.


Data lengkap tentang Gerhana Bulan tersebut dapat dilihat di bawah ini (klik untuk gambar dengan resolusi yang lebih besar, note: Jam WIB setara dengan UT + 7 jam dan fenomena gerhana dapat teramati baik setelah mulai masuk fasa U1):


Source: NASA dan Wikipedia

Sunday, December 13, 2009

Hujan Meteor Geminid di Penghujung Tahun 2009

Di penghujung tahun 2009, di tengah guyuran hujan yang turun hampir setiap harinya, kita akan mendapat kesempatan untuk menikmati Hujan Meteor Geminid yang merupakan hujan meteor tahunan. Jadi.. siapkan kopi dan coklat panas untuk menemanimu memandangi kilatan meter di malam hari…

Hujan meteor Geminid akan megalami puncaknya pada tanggal 13 – 14 Desember 2009, bertepatan dengan dimulainya Bulan Baru, sehingga ini akan menjadi kesempatan yang baik untuk melakukan pengamatan karena tidak akan ada cahaya bulan. Hujan meteor Geminid akan bisa teramati dari sleuruh wilayah di Indonesia pada tanggal 13 Desember malam menjelang dini hari dan pada tanggal 14 malam menjelang tengah malam. Menurut perkiraan International Meteor Organization, di saat maksimum meteor yang akan terlihat bisa mencapai 100 – 140 meteor per jam, pada tanggal 14 Desember jam 05.10 UT atau jam 12.10 wib.

Hujan meteor Geminid merupakan salah satu hujan meteor yang dinantikan karena intensitasnya yang terus meningkat dalam dekade ini dan diharapkan tren yang sama masih akan diteruskan.

Meteor yang tampak dari rasi Gemini ini berasal dari sisa pecahan obyek yang dikenal sebagai 3200 Phaethon, yang dulunya diperkirakan merupakan asteroid. Saat ini Phaethon sudah menjadi komet yang punah. Jadi sebenarnya, ia adalah kerangka batuan dari komet yang sudah kehilangan es setelah berkali-kali melintas Matahari dari dekat. Nah, Bumi yang melintas dalam aliran puing-puing 3200 Phaethon setiap tahun pada pertengahan Desember akan menyebabkan puing-puing itu terbang dari rasi Gemini/. Tepatnya di dekat bintang terang Castor dan Pollux.

Meteor Geminid pertama kali terlihat pada akhir abad ke-19, tak lama setelah perang sipil di Amerika berakhir. Pada saat pertama muncul, hujan meteornya masih lemah dan tidak terlalu menarik perhatian. Pada saat itu debu yang masuk atmosfer Bumi itu hanya bergerak dengan kecepatan 130000 km/jam. Di masa itu, sama sekali tak nampak kalau hujan meteor ini akan berlangsung setiap tahun. Yang menarik, saat ini hujan meteor Geminid merupakan salah satu hujan meteor yang cukup kuat dan menarik perhatian para pengamat. Bahkan ia semakin kuat dari tahun ke tahun. Hal ini disebabkan oleh gravitasi Jupiter yang berlaku pada aliran puing-puing Phaethon dan menyebabkan mereka bergeser mendekati orbit Bumi. Meteor Geminid sendiri masih tergolong meteor dengan kecepatan menengah pada kisaran 35 km / detik, sehingga akan mudah dikenali di bentangan langit malam.

Jadi, apa yang harus dilakukan untuk mengamati hujan meteor Geminid? Sediakan kopi..atau coklat panas. Keluarlah ke halaman atau area lapang. Bawa peta langit (planisphere/laptop/PDA yang sudah dilengkapi piranti peta langit) untuk dilihat, bawa senter, siapkan ipod, dan mulailah menatap langit ke arah timur laut, dimana rasi Gemini berada. Rasi Gemini akan terbit pada kisaran pukul 21.00 wib, jadi anda bisa keluar rumah mulai jam 21.00 sampai dini hari untuk menikmati hujan meteor Geminid.

Sumber: www.langitselatan.com

Monday, December 7, 2009

Mengenal Objek Langit

Di bawah ini ditampilkan foto langit dari daerah Himalaya (klik gambar untuk resolusi yang lebih besar). Coba analisa rasi apa yang nampak di sana. Selain itu, ada objek Messier yang muncul pula. Sebutkan apa namanya.

Jawabannya bisa dilihat di sini.

Sunday, December 6, 2009

Basic Astronomy: Phases of The Moon

Moon phases, or lunar phases, refer to the different appearances that the Moon takes on over the course of a lunar month. At the beginning of a lunar month, the Moon is dark. And then, over the course of the month, more and more of the Moon is illuminated until we see a full moon. Then the amount of illuminated moon decreases to a new moon again. Then the cycle starts all over again. These are the phases of the Moon.

When thinking about what causes the phases of the Moon, you've got to realize that the Moon is always half illuminated by the Sun. This is the same for all the objects in the Solar System. We see the different moon phases from here on Earth because our perspective of the Moon changes as it orbits around the Earth. When we can see the Moon fully illuminated, then the Sun and Moon are on opposite sides of the Earth; this is a full moon. The situation is reversed when the Moon and the Sun are on the same side of the Earth. This is when we see a new moon. The other lunar moon phases occur when the Moon makes various angles compared to the Earth.

Eight Phases of the Moon
Although the lunar phases actually transition smoothly from one phase to another, we have developed different terms for the 8 moon phases that look distinct. The Moon's appearance moves through each of these moon phases as the amount of sunlight falling on it changes from our perspective. this is a cycle that always moves in the same direction. The Moon will always go from new moon to first quarter then full moon, then last quarter and back to new moon again.

Here are the eight phases of the moon:

  1. New Moon – When the illuminated side of the Moon is away from the Earth. The Moon and the Sun are lined up on the same side of the Earth, so we can only see the shadowed side. This is also the time that you can experience solar eclipses, when the Moon passes directly in front of the Sun and casts a shadow onto the surface of the Earth. During a new moon, we can also see the reflected light from the Earth, since no sunlight is falling on the Moon – this is known as earthshine.
  2. Crescent – The crescent moon is the first sliver of the Moon that we can see. From the northern hemisphere, the crescent moon has the illuminated edge of the Moon on the right. This situation is reversed for the southern hemisphere.
  3. First Quarter – Although it's called a quarter moon, we actually see this phase when the Moon is half illuminated. This means that the Sun and the Moon make a 90-degree angle compared to the Earth.
  4. Waxing Gibbous – This phase of the Moon occurs when the Moon is more illuminated that half, but it's not yet a full Moon.
  5. Full Moon – This is the phase when the Moon is brightest in the sky. From our perspective here on Earth, the Moon is fully illuminated by the light of the Sun. This is also the time of the lunar month when you can see lunar eclipses – these occur when the Moon passes through the shadow of the Earth.
  6. Waning Gibbous – In this lunar phase, the Moon is less than fully illuminated, but more than half.
  7. Last Quarter – At this point of the lunar cycle, the Moon has reached half illumination. Now it's the left-hand side of the Moon that's illuminated, and the right-hand side in darkness (from a northern hemisphere perspective).
  8. Crescent – This is the final sliver of illuminated moon we can see before the Moon goes into darkness again.
And so, the Moon passes through each of these phases each lunar month. It takes a total of 29.53 days to go from new moon to new moon.

Source: universe today

Saturday, December 5, 2009

How Galaxies Lose Their Gas

As galaxies evolve, many lose their gas. But how they do this is a point of contention. One possibility is that it is used to form stars when the galaxies undergo intense periods of star formation known as starburst. Another is that when large galaxies collide, the stars pass through one another but the gas gets left behind. It's also possible that the gas is pulled out in close passes to other galaxies through tidal forces. Yet another possibility involves a wind blowing the gas out as galaxies plunge through the thin intergalactic medium in clusters through a process known as ram pressure.

A new paper lends fresh evidence to one of these hypotheses. In this paper, astronomers from the University of Arizona were interested in galaxies that displayed long gas tails, much like a comet. Earlier studies had found such galaxies, but it was unclear whether or not this gas tail was pulled out from tidal forces, or pushed out from ram pressure.

To help determine the cause of this the team used new observations from Spitzer to look for subtle differences in the causes of a tail following the galaxy ESO 137-001. In cases where tails are known to be pulled out tidally (such as in the M81/M82 system), there "is no physical reason why the gas would be preferentially stripped over stars." Stars from the galaxy are pulled out as well and often large amounts of new star formation are induced. Meanwhile, ram pressure tails should be largely free of stars although some new star formation may be expected if there is turbulence in the tail which causes regions of higher density (think like the wake of a boat).

Examining the tail spectroscopically, the team was unable to detect the presence of large numbers of stars suggesting tidal processes were not responsible. Furthermore, the disk of the galaxy seemed relatively undisturbed by gravitational interactions. To support this, the team calculated the relative strengths of the forces acting on the galaxy. They found that, between the tidal forces acting on the galaxy from its parent cluster, and its own centripetal forces, the internal forces where greater, which reaffirmed that tidal forces were an unlikely cause for the tail.

But to confirm that ram pressure was truly responsible, the astronomers looked at other parameters. First they estimated the gravitational force for the galaxy. In order to strip the gas, the force generated by the ram pressure would have to exceed the gravitational one. The energy imparted on the gas would then be measurable as a temperature in the gas tail which could be compared to the expected values. When this was observed, they found that the temperature was consistent with what would be necessary for ram stripping.

From this, they also set limits on how long gas could last in such a galaxy. They determined that in such circumstances, the gas would be entirely stripped from a galaxy in ~500 million to 1 billion years. However, because the density of the gas through which the galaxy would slowly become denser as it passed through the more central regions of the cluster, they suggest the timescale would be much simpler. While this timescale say seem long, it is still shorter than the time it takes such galaxies to make a full orbit in their cluster. As such, it is possible that even in one pass, a galaxy may lose its gas.

If the gas loss occurs on such short timescales, this would further predict that tails like the one observed for ESO 137-001 should be rare. The authors note that an “X-ray survey of 25 nearby hot clusters only discovered 2 galaxies with X-ray tails.”

Although this new study in no way rules out other methods of removing a galaxy's gas, this is one of the first galaxies for which the ram stripping method is conclusively demonstrated.

Source: universe today
Original source: A Warm Molecular Hydrogen Tail Due to Ram Pressure Stripping of a Cluster Galaxy

Tuesday, December 1, 2009

2012 Doomsday Hoax

Sudahkah Anda menonton film 2012? Film ini mengisahkan tentang bencana besar yang diperkirakan akan terjadi pada tahun tersebut. Namun, tahukah Anda banyak fake science yang dimasukkan dalam film tersebut? Jadi, Anda tidak perlu khawatir dunia akan segera kiamat karena tidak ada alasan dan bukti kuat tentang ramalan semacam itu. Berikut ini akan ditampilkan sebuah artikel dari universe today, yang menuliskan pendapat NASA tentang isu-isu yang tidak benar yang diperkirakan orang (bahkan dengan bodohnya dipercaya orang) akan terjadi di tahun 2012 (khususnya di tanggal 21 Desember 2012).


NASA is now joining in to combat the 2012 nonsense. Don Yeomans, manager of NASA's Near Earth Object office has produced a video and written an article, providing the scientific realities surrounding the celestial happenings of 2012. Yeomans has done a wonderful job explaining everything that is and isn't going to happen in 2012, and we're happy to add his work to our collection of 2012 debunking articles.

The Galileo spacecraft's view of the Moon and Earth On December 16, 1992, 8 days after its encounter with Earth, the Galileo spacecraft looked back from a distance of about 6.2 million kilometers (3.9 million miles) to capture this remarkable view of the Moon in orbit about Earth. Image credit: NASA/JPL There apparently is a great deal of interest in celestial bodies, and their locations and trajectories at the end of the calendar year 2012. Now, I for one love a good book or movie as much as the next guy. But the stuff flying around through cyberspace, TV and the movies is not based on science. There is even a fake NASA news release out there… So here is the scientific reality on the celestial happenings in the year 2012.

Nibiru, a purported large object headed toward Earth, simply put – does not exist. There is no credible evidence – telescopic or otherwise – for this object's existence. There is also no evidence of any kind for its gravitational affects upon bodies in our solar system.

The Mayan calendar does not end in December 2012. Just as the calendar you have on your kitchen wall does not cease to exist after December 31, the Mayan calendar does not cease to exist on December 21, 2012. This date is the end of the Mayan long-count period, but then – just as your calendar begins again on January 1 – another long-count period begins for the Mayan calendar.

There are no credible predictions for worrisome astronomical events in 2012. The activity of the sun is cyclical with a period of roughly 11 years and the time of the next solar maximumis predicted to occur in the period 2010 – 2012. However, the Earth routinely experiences these periods of increased solar activity – for eons (very long period of time -red) – without worrisome effects. The Earth’s magnetic field, which deflects charged particles from the sun, does reverse polarity on time scales of about 400,000 years but there is no evidence that a reversal, which takes thousands of years to occur, will begin in 2012. Even if this several thousand year-long magnetic field reversal were to begin, that would not affect the Earth’s rotation nor would it affect the direction of the Earth’s rotation axis… only Superman can do that.

The only important gravitational tugs experienced by the Earth are due to the moon and sun. There are no planetary alignments in the next few decades, Earth will not cross the galactic plane in 2012, and even if these alignments were to occur, their effects on the Earth would be negligible. Each December the Earth and Sun align with the approximate center of the Milky Way Galaxy but that is an annual event of no consequence.

The predictions of doomsday or dramatic changes on December 21, 2012 are all false. Incorrect doomsday predictions have taken place several times in each of the past several centuries. Readers should bear in mind what Carl Sagan noted several years ago; "extraordinary claims require extraordinary evidence."

For any claims of disaster or dramatic changes in 2012, the burden of proof is on the people making these claims. Where is the science? Where is the evidence? There is none, and all the passionate, persistent and profitable assertions, whether they are made in books, movies, documentaries or over the Internet, cannot change that simple fact. There is no credible evidence for any of the assertions made in support of unusual events taking place in December 2012.

Written by Don Yeomans, NASA senior research scientist