Showing posts with label materi. Show all posts

Monday, February 7, 2011

Definisi Planet - Mengapa Pluto tidak termasuk kategori Planet?

Mungkin beberapa tahun lalu, jumlah planet yang kita kenal ada 9, yaitu: Merkurius, Venus, Bumi, Mars, Jupiter, Saturnus, Uranus, Neptunus dan Pluto. Namun, tahukah Anda bahwa pada tahun 2006, International Astronomical Union (IAU) telah menentukan definisi planet yang baru. Imbas dari definisi planet yang baru ini sangat besar, karena Pluto yang sudah familiar dikenal sebagai sebuah planet akhirnya harus tersingkir dari "gelar"-nya. Tahukah Anda mengapa Pluto akhirnya "tersingkir"?

Planet, secara etimologis berarti pelancong (wanderer). Pada akhir abad ke-19, istilah Planet sudah menjadi istilah umum, meskipun belum ada batasan yang jelas mengenai kriteria suatu benda yang dapat dianggap sebagai planet. Umumnya, istilah "planet" diberikan kepada objek yang mengitari Matahari dan berukuran lebih besar daripada Pluto.

Setelah tahun 1992, astronomer telah menemukan banyak objek di luar orbit Neptunus (dikenal dengan istilah Trans-Neptunian Objects atau TNO) dan ratusan objek yang mengitari bintang lain (extrasolar planet, lihat artikel sebelumnya). Penemuan ini tidak hanya menambah jumlah dr objek yang potensial disebut planet, tetapi juga memperluas kenaekaragaman dan keanehan (peculiarity) dari objek-objek yang "masuk" kategori planet berdasarkan definisi/pengertian umum. Beberapa objek yang ditemukan tersebut ada yang lebih kecil daripada satelit Bumi, Bulan dan ada juga yang cukup besar untuk menjadi sebuah bintang. Penemuan - penemuan inilah yang membuat astronom merasa adanya kebutuhan untuk menentukan definisi dari sebuah Planet secara jelas agar tidak sembarang objek bisa dianggap sebagai planet.

File:Outersolarsystem objectpositions labels comp.png
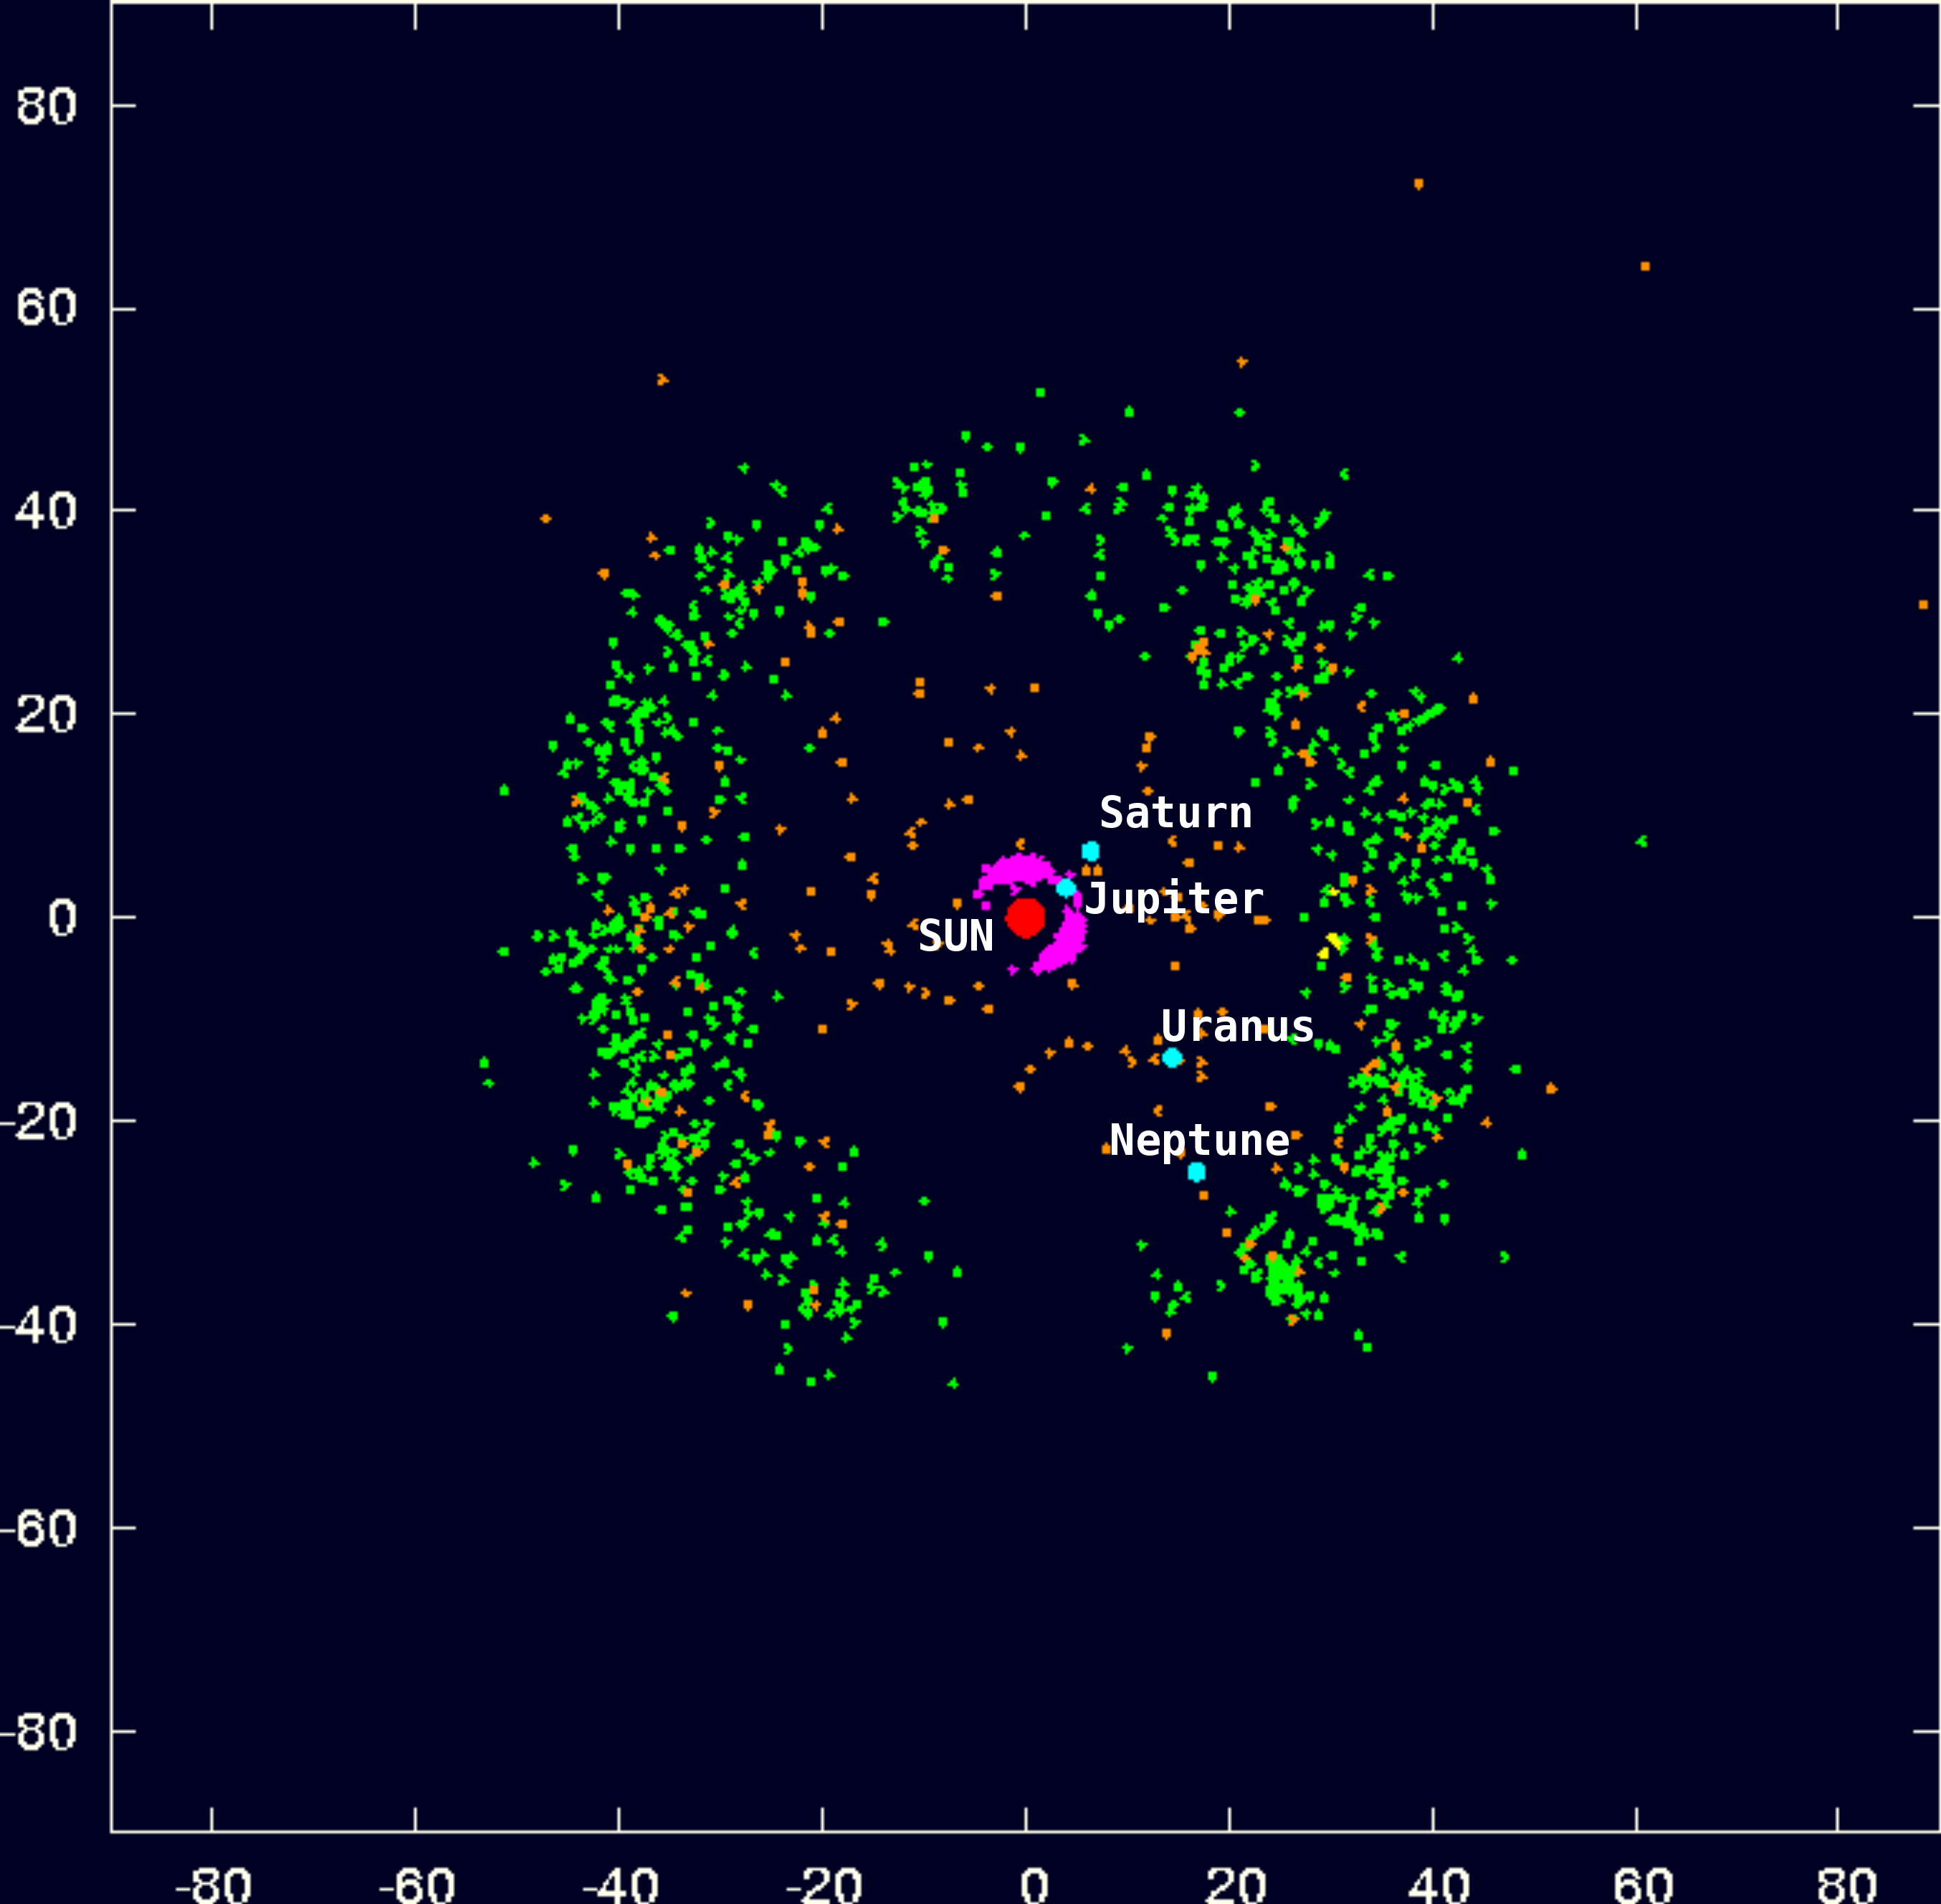
Plot of the positions of all known Kuiper belt objects (green), set against the outer planets (blue)

Perlunya definisi yang jelas untuk Planet menjadi semakin jelas ketika ditemukannya TNO yang diberi nama Eris. Ukuran Eris lebih besar daripada ukuran Pluto, yang sebelumnya dianggap sebagai ukuran minimum untuk sebuah planet. Oleh sebab itu, pada bulan Agustus 2006, International Astronomical Union (IAU) mengadakan konferensi untuk membuat definisi baru Planet.
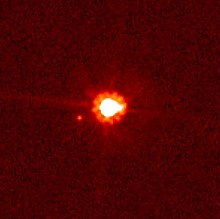
Eris as seen with the Hubble Space Telescope

DEFINISI PLANET BERDASARKAN IAU TAHUN 2006

The final definition, as passed on 24 August 2006 under the Resolution 5A of the 26th General Assembly is:


Illustration of the outcome of the vote

The IAU resolves that planets and other bodies, except satellites, in our Solar System be defined into three distinct categories in the following way:

(1) A planet [1] is a celestial body that:
  • (a) is in orbit around the Sun,
  • (b) has sufficient mass for its self-gravity to overcome rigid body forces so that it assumes a hydrostatic equilibrium (nearly round) shape, and
  • (c) has cleared the neighbourhood around its orbit.
(2) A "dwarf planet" is a celestial body that (a) is in orbit around the Sun, (b) has sufficient mass for its self-gravity to overcome rigid body forces so that it assumes a hydrostatic equilibrium (nearly round) shape [2], (c) has not cleared the neighbourhood around its orbit, and (d) is not a satellite.

(3) All other objects [3], except satellites, orbiting the Sun shall be referred to collectively as "Small Solar System Bodies".

Footnotes:
[1] The eight planets are: Mercury, Venus, Earth, Mars, Jupiter, Saturn, Uranus, and Neptune.
[2] An IAU process will be established to assign borderline objects into either dwarf planet and other categories.
[3] These currently include most of the Solar System asteroids, most Trans-Neptunian Objects (TNOs), comets, and other small bodies.

The IAU further resolves:
Pluto is a "dwarf planet" by the above definition and is recognized as the prototype of a new category of Trans-Neptunian Objects[1].

Footnote:
[1] An IAU process will be established to select a name for this category.
The IAU also resolved that "planets and dwarf planets are two distinct classes of objects", meaning that dwarf planets, despite their name, would not be considered planets
.
Penjelasan di atas adalah bunyi dari keputusan IAU mengenai definisi Planet yang baru. Secara sederhana, syarat- syarat sebuah objek dapat dikategorikan sebagai planet dalam tata surya ini jika:
  1. mengitari Matahari
  2. memiliki massa yang cukup untuk mencapai kondisi kesetimbangan hidrostatis (secara sederhana, objek yang sudah mencapai kondisi kesetimbangan hidrostatis memiliki bentuk bola sempurna).
  3. telah "membersihkan objek-objek tetangga" dari orbitnya. atau dengan kata lain, massa Planet adalah massa yang dominan dibandingkan massa seluruh benda lain yang berada di orbit yang sama.
Sebuah objek yang tidak termasuk satelit dan hanya memenuhi dua syarat pertama akan diklasifikasikan sebagai dwarf planet (planet kerdil). Bagi objek yang hanya memenuhi syarat pertama (mengitari Matahari), akan disebut Small Solar System Body (SSSB) atau objek kecil di tata surya. Draft awal merencanakan akan memasukkan dwarf planet sebagai sub-kategori dari planet, tetapi karena keputusan ini akan mengakibatkan penambahan beberapa lusin objek ke dalam tata surya, draft ini dibatalkan. Di tahun 2006, yang termasuk dwarf planet adalah Ceres, Eris, Makemake, dan Pluto. Keputusan ini termasuk keputusan yang kontroversial dan menimbulkan dukungan dan kritik dari cukup banyak astronom, tetapi definisi inilah yang dipakai resmi hingga saat ini.

Jad, berdasarkan definisi yang baru ini, saat ini ada 8 planet yang diakui (Merkurius, Venus, Bumi, Mars, Jupiter, Saturnus, Uranus, dan Neptunus) dan ada lima planet kerdil (Pluto, Ceres, Eris, Makemake, dan Haumea). Definisi ini hanya berlaku untuk Tata Surya kita karena extrasolar Planet belum diketahui dengan jelas/akurat ukurannya. Extrasolar planets atau exoplanets akan didefinisikan dalam referensi lain, yang memisahkan/membedakan exoplanet dan dwarf stars (bintang kerdil).

Pertanyaan evaluasi:
1. Mengapa perlu adanya definisi baru untuk Planet?
2. Jelaskan definisi baru/syarat-syarat sebuah objek dijadikan Planet? Planet Kerdil?

Friday, February 4, 2011

Mendeteksi dan Menemukan Extrasolar Planet

Belakangan ini banyak dibahas di berbagai media tentang penemuan planet di tata surya lain. Dalam artikel ini, akan dibahas beberapa teknik 'sederhana' yang digunakan astronom untuk menemukan planet di luar tata surya.

Seperti yang Anda ketahui bahwa bintang akan selalu terlihat sebagai point of light (sumber titik cahaya) meskipun menggunakan teleskop (kecuali untuk beberapa bintang yang besar dan 'dekat' dengan kita). Oleh sebab itu, dapat diperkirakan bahwa mengamati planet yang ada di bintang lain tentunya bukan perkara yang mudah.

Sebelum kita membahas bagaimana menemukan planet extrasolar (planet yang ada di luar tata surya kita), akan dibahas terlebih dahulu sekilas mengenai proses pembentukan planet.

SEJARAH SINGKAT TERBENTUKNYA PLANET

Semuanya berawal dari material awan debu. Tata surya (planetary system/sistem keplanetan) berasal dari awan berputar yang maha besar. Awan kabut itu (nebulae) mengerut di bawah gaya berat diri, membentuk piringan dengan protosurya yang sangat padat di pusat. Akibat pengerutan gravitasi suhu naik di dalam awan (pengerutan Kelvin Helmholtz). Di pusat kian sangat panas, lalu terpicu reaksi bom nuklir, dan pengerutan piringan akan berhenti.

Planet-planet terbentuk oleh akresi planetesimal dan akumulasi gas di dalam kabut surya. Planetesimal di tahap awal tatasurya, tabrakan dan akresi (saling menempel) membentuk protoplanet. Planet dari unsur-unsur berat terbentuk dan memadat di bagian dalam, suhu jadi lebih panas (di pusat), unsur-unsur ringan berdifusi ke tepi luar. Proses itu dikenal sebagai diferensiasi dari unsur-unsur.


Bintang yang masih muda (yang terbentuk di pusat akresi) tiba-tiba menyemburkan tenaga kuat, tenaga jet dan sangat singkat, dan membersihkan tata surya dari materi pembentuk planet yang tersisa. Bintang-bintang muda penyembur tenaga semacam itu dikenal sebagai Bintang-Bintang T Tauri .

Setelah itu, tata surya akan 'stabil'. Planet - planet butuh jutaan tahun untuk menggumpal dan membersihkan 'orbit'-nya serta mendingin hingga mencapai kondisi stabil.

PLANET DI TATA SURYA LAIN (EXTRASOLAR PLANETS)

Para astronom telah menemukan planet-planet mengorbit di bintang-bintang. Planet besar, seperti Yupiter, menarik bintang pusatnya ke dalam sehingga bintang terputar dalam satu orbit kecil mengitari titik pusat massa mereka. Planet yang mengorbit bintang lain itu disebut extrasolar planets.

Meski Planet sangat besar, tetap tak bisa dilihat, karena bintang sentral sangat terang. Namun, pergerakan kecil yang ditempuh bintang sentral karena gravitasi oleh planet, kadangkala dapat terdeteksi. Para astronom mengukur dengan teliti pergerakan bintang dengan memperhatikan sinarnya. Sinar bintang itu bergantian bergeser ke riak gelombang merah dan ke riak gelombang biru. Telah terdeteksi dengan cara itu lebih dari 100 extrasolar planet. Cara itu dikenal sebagai metode Pergeseran Doppler.

Beberapa planet yang sudah ditemukan:


OGLE-2005-BLG-390Lb planet extrasolar terkecil saat ini (2006). 188 extrasolar planet (18 April 2006) berbagai rentang massa dan periode orbit, namun planet sebesar massa Neptunus sangat sedikit/belum terdeteksi pada jarak > 0,15 SA dari bintang pusat. OGLE-2005-BLG-390Lb bermassa 5,5 (-2,7 to +5,5) massa bumi. Pada jarak pisah 2,6(-0,6 to +1,5) SA dari bintang kerdil-M bermassa 0,22(-0,11 to +0,21) massa matahari (68% rentang kepastian). Teori akresi planet meramalkan banyak planet bermassa lebih kecil daripada planet Neptunus ditemukan daripada planet raksasa Jupiter.

Jadi, ada banyak metode yang dapat digunakan oleh astronom untuk mendeteksi keberadaan planet/sistem keplanetan di bintang -bintang lain. Metode-metode tersebut antara lain:
  1. Kecepatan radial (pergeseran Doppler)
  2. Astrometri (proper motion, sangat terbatas)
  3. Gravitasi Mikrolensa (planet dan bintang induk berada di depan bintang latar belakang)
  4. Metode Transit (planet lewat di depan bintang induk)
  5. Piringan Circumbintang (distorsi awan debu oleh planet yang mengorbit)
  6. Pengamatan Direct (langsung) oleh teropong Spitzer.

1. METODE PERGESERAN DOPPLER
(KECEPATAN RADIAL/KR)

Jika astrometri langsung mengamati bintang, maka metode KR, mengamati gerak bintang dari spektrum cahaya. Yakni secara sistematik memperhatikan pergeseran garis spektrum serapan dan pancaran. Dengan teleskop sekarang, hanya dapat diukur kecepatan sedikitnya 3 m/s. Bumi, misalnya hanya mempengaruhi gerak matahari sebesar 0.1 m/s. Dengan mengukur T dan mendapatkan massa bintang, mBINTANG, bisa ditemukan 1/2 sumbu panjang orbit.


Jika massa bintang dapat diturunkan dari (mis. Diagram H-R) dan inklinasi orbit terhadap bidang ekliptika, i, diketahui, maka massa planet, mP dapat dihitung dengan persamaan di bawah ini. Jika i tidak dapat diketahui, maka yang kita peroleh hanyalah mP sin i.


Jadi sekarang kita sudah dapat menghitung massa planet (bila mengetahui inklinasi atau dengan mengambil asumsi).

Kecepatan radial untuk beberapa planet:
u/ Jupiter: v = 13 m/detik dan periode T = 12 tahun.
u/ Bumi : v = 0.09 m/detik dan periode T = 1 tahun
Limit deteksi hanya 3 m/detik, jadi planet-planet semacam Bumi sangat sulit teramati.

Penemuan pertama extrasolar planet terjadi di tahun 1995 di bintang 51 Pegasus.
Kini, lebih dari 120 planet seukuran Yupiter telah ditemukan di bintang-bintang lain dengan metode KR/Doppler. Orbit-orbitnya pendek, eksentrisitas tinggi serta harga massa mencapai setinggi 10 massa Yupiter.

2. METODE ASTROMETRI


Pertanyaannya: Dapatkah keberadaan planet seperti Jupiter diketahui dengan astrometri?

Sayang sekali, belum dapat. Mengapa? Mari kita lakukan perhitungan singkat.

Matahari mengorbit pusat gravitasi Matahari-Yupiter pada jejari orbit hanya 1.2 jejari matahari. 1.2 jejari matahari memetakan sudut sebesar 5.2 x 10⁻³ detikbusur pada jarak 1 parsec – atau 5.2 x 10⁻⁴ detikbusur pada jarak 10 pc. Kecermatan pengukuran hingga sudut sekecil itu masih belum dapat (sulit) dilakukan.

3. METODE MIKROLENSA (memanfaatkan sifat/fenomena gravitational lensing)


Gravitasi Mikrolensa terjadi jika planet dan bintang induk berada di depan bintang latar belakang.

4. METODE TRANSIT


Saat sebuah planet (benda gelap) melintas di depan bintang induknya, sebagian sinar bintang induknya akan terhalangi (ter-gerhana-i) oleh planet yang melintas. Peristiwa ini disebut transit planet (lihat diagram di bawah ini). Astronom akan mencari bintang2 yang kecerlangannya menurun secara periodik.


Jika sebuah bintang jauh di transit oleh sebuah planet semacam Yupiter, terjadi penurunan flux sinar sebesar 1% di bintang itu dari semulanya.

Sebuah planet yang telah ditemukan di bintang HD209458 dengan metode KR; pada tahun 1999, diamati kembali flux bintangnya. Ditemukan transit tepat pada waktu yang telah diramal sebelumnya. Seperti planet di 51Peg, planet itu besar dan mengorbit dekat sekali dengan bintang – planet semacam ini dikenali sebagai “hot Jupiters”.

Metode transit inilah yang digunakan oleh Teleskop Keppler. Teleskop ini dikhususkan untuk 'mencari' planet serupa Bumi. (penjelasan lebih detailnya silakan lihat di sini dan sini). Hasil kerja teleskop ini dapat dibaca pada link yang diberikan.


5. METODE PENGAMATAN LANGSUNG DENGAN TEROPONG SPITZER


KESIMPULAN
  • Metode KR hanya dapat mendeteksi planet-planet masif (sedikitnya 1/5 massa Yupiter) dengan periode relatif yang sangat pendek.
  • Kebanyakan planet-planet yang terdeteksi berada sangat dekat dengan bintang (kurang dari ~0.1SA)
  • 3-4% bintang-bintang serupa matahari memiliki planet-planet jenis itu
  • Sejumlah kecil planet-planet yang lebih jauh umumnya mempunyai orbit yang lebih eksentrik (e >~0.2)
Planet-planet yang sudah ditemukan beserta informasi massa bintang induk dan periode orbitnya.


Bintang - bintang di angkasa ini sangat banyak. Bagaimana astronom dapat memilih bintang mana yang diamati/dicurigai memiliki sistem planet?

Sistem planet tidak bisa terbentuk pada bintang bintang yang luminositasnya besar. Hal ini disebabkan bintang-bintang seperti ini memiliki massa hidup yang cenderung singkat. Bintang-bintang generasi I (yang terbentuk dari material Big Bang) juga tidak mungkin memiliki sistem keplanetan karena kurangnya unsur-unsur berat. Jadi, bintang-bintang yang mungkin memiliki sistem keplanetan adalah bintang-bintang yang tidak terlalu panas dan termasuk Generasi ke dua atau lebih (bintang yang materialnya berasal dari sisa material bintang lain yang meledak lewat Supernova/hembusan saat pembentukan Planetary Nebulae).

LATIHAN

Sumber:
1. Materi pelatihan olimpiade Astronomi oleh Tim Astronomi ITB
2. Wikipedia

notes: jika ingin melihat gambar yang ada dengan lebih jelas, silakan klik di masing-masing gambar

SELAMAT BELAJAR

Wednesday, December 8, 2010

Tipe - Tipe Galaksi

Dengan mempergunakan teleskop 250 cm di Observatorium Mount Palomar, astronom Edwin Hubble (1924) memotret sebuah galaksi di rasi Andromeda. Dia menjelaskan, untuk ertama kalinya, bentuk galaksi yang kemudian terkenal dengan nama galaksi Andromeda, berjarak 2 juta tahun cahaya dari galaksi kita (Bimasakti/Milkyway). Galaksi Andromeda merupakan galaksi luar (extra galaxy) pertama yang diketahui astronom. Sejak penemuannya, banyak studi dilakukan dalam mempelajari galaksi-galaksi di luar galaksi Bimasakti tempat kita berada.

Upaya para astronom mempelajari galaksi melalui pengamatan semenjak abad ke-18, telah melahirkan berbagai katalog benda-benda langit yang meliputi gugusan bintang termasuk didalamnya adalah galaksi. Pada tahun 1888, J.L.E. Dreyer mempublikasikan New General Catalogue of nebulae and Clusters of Stars yang memuat 7840 obyek langit. Katalog ini dilengkapi dengan suplemennya, Index Catalogues pada tahun 1895 dan 1908. Umumnya katalog tersebut mempergunakan notasi NGC atau IC diikuti dengan nomor obyek dalam daftar. Sebagai contoh, galaksi Andro-meda diberi nomor katalogus NGC 224.

Ada banyak galaksi-galaksi dengan berbagai ragam bentuknya. Hubble mengklasifikasikan galaksi-galaksi berdasarkan bentuknya ke dalam 3 kelompok utama, yakni:

1. Galaksi spiral (S)
Populasi galaksi berbentuk spiral ini yang terbanyak (80%). Galaksi ini memiliki struktur yang paling teratur dengan pusat, selubung bulat dan piringan dengan lengan spiral yang mengelilingi ekuator galaksi. Variasi dari galaksi spiral adalah galaksi spiral berbatang (SB), dengan bentuk cerutu yang melintasi pusat dan di kedua ujungnya pola spiral menjuntai.

2. Galaksi eliptik (E)
Galaksi dengan bentuk ini meliputi 17% dari seluruh populasi galaksi di alam semesta. Bentuknya lebih sederhana dibandingkan dengan galaksi spiral, karena hanya terdiri dari pusat dan selubung pipih. Kerapatan bintang lebih tinggi di pusat dibanding di tepiannya.

3. Galaksi tidak beraturan
Sebanyak 3% dari galaksi yang teramati sejauh ini menunjukkan bentuk yang tidak beraturan. Bentuknya lebih merupakan onggokan bintang dengan batas yang kurang jelas. Berbagai contoh nyata galaksi ini antara lain Awan Magellan kecil dan besar, tetangga galaksi kita, Bima Sakti.
Pola galaksi yang dirangkum dan diklasifikasikan oleh Hubble ditafsirkannya sebagai perjalanan evolusi galaksi di alam semesta dari bentuk yang awalnya sangat teratur menuju bentuk yang tidak beraturan.

Sunday, March 14, 2010

Sekilas Tentang Badai Matahari

Matahari adalah sumber dari semua energi yang kita kenal di Bumi. Jika kita merunut semua sumber energi yang kita kenal dan kita gunakan sehari-hari, semuanya akan bermuara pada Matahari. Matahari sendiri menghasilkan energi lewat reaksi nuklir yang terjadi di pusatnya. Namun, meski Matahari memegang peran penting sebagai sumber energi yang kita butuhkan, Matahari juga menyimpan potensi yang bisa memberikan ancaman bagi manusia dan ekosistem Bumi. Ancaman yang dimaksud adalah peristiwa yang dikenal dengan nama badai matahari.

Gambar 1. Struktur Matahari

Sebelum membicarakan tentang badai matahari, kita akan melihat sekilas tentang Matahari. Matahari adalah sebuah bintang, yaitu bola plasma panas yang ditopang oleh gaya gravitasi. Di pusat Matahari (nomor 1 dalam Gambar 1), terjadi reaksi nuklir (fusi) yang mengubah 4 atom hidrogen menjadi 1 atom helium. Reaksi fusi tersebut, selain menghasilkan helium, juga menghasilkan energi dalam jumlah melimpah (ingat persamaan terkenal oleh Einstein: E=mc2). Energi yang dihasilkan, di pancarkan keluar melewati bagian-bagian Matahari, yaitu: zona radiatif (nomor 2), zona konventif (nomor 3), dan bagian atmosfer Matahari, yang terdiri dari fotosfer (nomor 4), kromosfer (nomor 5), dan korona (nomor 6). Dan badai Matahari adalah peristiwa yang berkaitan dengan bagian atmosfer Matahari tersebut.

Bagian terluar dari Matahari, yaitu korona, memiliki temperatur yang mencapai jutaan kelvin. Dengan temparatur yang tinggi tersebut, materi yang berada di korona Matahari memiliki energi kinetik yang besar. Tarikan gravitasi Matahari tidak cukup kuat untuk mempertahankan materi korona yang memiliki energi kinetik yang besar itu dan secara terus menerus, partikel bermuatan yang berasal dari korona, akan lepas keluar angkasa. Aliran partikel ini dikenal dengan nama angin matahari, yang terutama terdiri dari elektron dan proton dengan energi sekitar 1 keV. Setiap tahunnya, sebanyak 1012 ton materi korona lepas menjadi angin matahari, yang bergerak dengan kecepatan antara 200-700 km/s.

Berbeda dengan pusat Matahari yang relatif sederhana, bagian atmosfer Matahari relatif lebih rumit. Karena di atmosfer Matahari ini, medan magnetik Matahari berperan besar terhadap berbagai peristiwa yang terjadi di dalamnya. Ada berbagai fenomena menarik diamati di atmosfer Matahari berkaitan dengan medan magnetik Matahari, seperti bintik matahari (sun spot), ledakan Matahari (solar flare), prominensa, dan pelontaran material korona (CME – Coronal Mass Ejection). Hal-hal inilah yang berkaitan dengan badai matahari.

Jadi apa yang dimaksud dengan badai matahari?

Singkatnya, badai matahari adalah kejadian/event dimana aktivitas Matahari berinteraksi dengan medan magnetik Bumi. Badai matahari ini berkaitan langsung dengan peristiwa solar flare dan CME. Kedua hal itulah yang menyebabkan terjadinya badai matahari.

Solar flare adalah ledakan di Matahari akibat terbukanya salah satu kumparan medan magnet permukaan Matahari. Ledakan ini melepaskan partikel berenergi tinggi dan radiasi elektromagnetik pada panjang gelombang sinar-x dan sinar gamma. Partikel berenergi tinggi yang dilepaskan oleh peristiwa solar flare, jika mengarah ke Bumi, akan mencapai Bumi dalam waktu 1-2 hari. Sedangkan radiasi elektromagnetik energi tingginya, akan mencapai Bumi dalam waktu hanya sekitar 8 menit.

Lalu bagaimana dengan CME?

CME adalah pelepasan material dari korona yang teramati sebagai letupan yang menyembur dari permukaan Matahari. Dalam semburan material korona ini, sekitar 2×10¹¹ – 4×10¹³ kilogram material dilontarkan dengan energi sebesar 1022 – 6×1024 joule. Material ini dilontarkan dengan kecepatan mulai dari 20 km/s sampai 2000 km/s, dengan rata-rata kecepatan 350 km/s. Untuk mencapai Bumi, dibutuhkan waktu 1-3 hari.

Matahari kita memiliki siklus keaktifan dengan periode sekitar 11 tahun. Siklus keaktifan ini berkaitan dengan pembalikan kutub magnetik di permukaan Matahari. Keaktifan Matahari ini bisa dilihat dari jumlah bintik matahari yang teramati. Saat keaktifan Matahari mencapai maksimum, kita akan mengamati bintik matahari dalam jumlah paling banyak di permukaan Matahari dan pada saat keaktifan Matahari mencapai maksimum inilah, angin matahari lebih ‘kencang’ dari biasanya dan partikel-partikel yang dipancarkan juga lebih energetik. Dan peristiwa solar flare dan CME dalam skala besar juga lebih dimungkinkan untuk terjadi. Dengan kata lain, saat keaktifan Matahari mencapai maksimum, Bumi akan lebih banyak dipapar dengan partikel-partikel bermuatan tinggi (lebih tinggi dari biasanya) dan radiasi elektromagnetik energi tinggi.

Partikel-partikel bermuatan yang dipancarkan dari peristiwa solar flare dan CME, saat mencapai Bumi, akan berinteraksi dengan medan magnetik Bumi. Interaksi ini akan menyebabkan gangguan pada medan magnetik Bumi buat sementara.

Saat partikel-partikel bermuatan dengan energi tinggi mencapai Bumi, ia akan diarahkan oleh medan magnetik Bumi, untuk bergerak sesuai dengan garis-garis medan magnetik Bumi, menuju ke arah kutub utara dan kutub selatan magnetik Bumi. Saat partikel-partikel energetik tersebut berbenturan dengan partikel udara dalam atmosfer Bumi, ia akan menyebabkan partikel udara (terutama nitrogen) terionisasi. Bagi kita yang berada di permukaan Bumi, yang kita amati adalah bentuk seperti tirai-tirai cahaya warna-warni di langit, yang dikenal dengan nama aurora. Aurora ini bisa diamati dari posisi lintang tinggi di sekitar kutub magnetik Bumi (utara dan selatan).

Gambar 2. Aurora

Saat terjadi badai matahari, partikel-partikel energetik tadi tidak hanya menghasilkan aurora yang indah yang bisa di amati di lintang tinggi. Tapi bisa memberikan dampak yang relatif lebih besar dan lebih berbahaya. Dampak yang dimaksud antara lain: gangguan pada jaringan listrik karena transformator dalam jaringan listrik akan mengalami kelebihan muatan, gangguan telekomunikasi (merusak satelit, menyebabkan black-out frekuensi HF radio, dll), navigasi, dan menyebabkan korosi pada jaringan pipa bawah tanah.

Peristiwa gangguan besar yang disebabkan oleh badai matahari, yang paling terkenal adalah peristiwa tahun 1859, peristiwa yang dikenal dengan nama Carrington Event. Saat itu, jaringan komunikasi telegraf masih relatif baru tapi sudah luas digunakan. Ketika terjadi badai Matahari tahun 1859, jaringan telegraf seluruh Amerika dan Eropa mati total. Aurora yang biasanya hanya bisa diamati di lintang tinggi, saat itu bahkan bisa diamati sampai di equator.

Masih ada beberapa contoh peristiwa lain yang berkaitan dengan badai matahari yang terjadi dalam abad ke-20 dan 21:

  1. 13 maret 1989: Terjadi CME besar 4 hari sebelumnya. Badai geomagnetik menghasilkan arus listrik induksi eksesif hingga ribuan ampere pada sistem interkoneksi kelistrikan Ontario Hydro (Canada). Arus induksi eksesif ini menyebabkan sejumlah trafo terbakar. Akibat dari terbakarnya trafo tsb, jaringan listrik di seluruh Quebec (Canada) putus selama 9 jam. Guncangan magnetik badai sekitar seperempat Carrington event, (sekitar 400 nT). Aurora teramati sampai di Texas
  2. Januari 1994 : 2 buah satelit komunikasi Anik milik Canada rusak akibat digempur elektron-elektron energetik dari Matahari. Satu satelit bisa segera pulih dalam waktu beberapa jam, namun satelit lainnya baru bisa dipulihkan 6 bulan kemudian.
    Total kerugian akibat lumpuhnya satelit ini disebut mencapai US $ 50 – 70 juta.
  3. November 2003 : Mengganggu kinerja instrumen WAAS berbasis GPS milik FAA AS selama 30 jam.
  4. Januari 2005: Berpotensi mengakibatkan black-out di frekuensi HF radio pesawat, sehingga penerbangan United Airlines 26 terpaksa dialihkan menghindari rute polar (kutub) yang biasa dilaluinya.

Badai Matahari juga bisa berbahaya bagi makhluk hidup secara biologi. Bahaya ini terutama bagi para astronot yang kebetulan sedang berada di luar angkasa saat badai matahari terjadi. Bagi kita yang berada di permukaan Bumi, kita relatif aman terlindungi oleh medan magnetik Bumi. Pengaruh langsung dari badai matahari ini hanya dialami oleh binatang-binatang yang peka terhadap medan magnetik Bumi. Karena badai matahari mengganggu medan magnetik Bumi, maka binatang-binatang yang peka terhadap medan magnetik akan secara langsung terimbas. Misalnya burung-burung, lumba-lumba, dan paus, yang menggunakan medan magnetik Bumi untuk menentukan arah, untuk sesaat ketika badai matahari terjadi, mereka akan kehilangan arah.

Saat ini, Matahari sedang menuju puncak keaktifan dalam siklusnya yang ke-24. Puncak keaktifan Matahari ini diperkirakan terjadi sekitar tahun 2011-2013. Saat puncak keaktifan Matahari pada siklus ke-24 ini, diperkirakan tidak akan jauh berbeda dengan saat puncak keaktifan pada siklus-siklus sebelumnya. Mungkin efeknya akan sedikit lebih besar, tapi ada juga yang menduga akan terjadi hal yang sebaliknya, justru lebih kecil efeknya. Yang manapun itu kasusnya, bisa dikatakan semua ahli fisika matahari sepakat tidak mungkin terjadi peristiwa besar yang akan membahayakan kehidupan di muka Bumi.

Berdasarkan pengetahuan kita saat ini, badai matahari hanya akan memberikan ancaman bahaya yang rendah. Solar flare dan CME yang terjadi di Matahari, tidak akan cukup untuk menyebabkan peristiwa seperti yang digambarkan dalam beberapa film yang beredar belakangan ini. Beberapa bintang yang diamati memang menunjukkan adanya peristiwa yang dikenal dengan istilah superflare, yaitu flare seperti yang kita amati di Matahari tapi dengan intensitas yang jauh lebih besar. Tapi peristiwa serupa diduga bukan peristiwa yang umum dan diragukan bakal terjadi pada Matahari kita, setidaknya saat ini. Memang peristiwa solar flare dan CME belum bisa diprediksi dengan baik untuk saat ini. Tapi pengetahuan kita yang didapat dari pengamatan Matahari lewat berbagai observatorium landas-bumi dan wahana antariksa yang terus menerus mengamati Matahari, kita semakin mengerti berbagai peristiwa yang terjadi di Matahari. Setidaknya untuk saat ini, kita bisa mengatakan dengan cukup yakin bahwa yang digambarkan dalam film-film fiksi ilmiah (misalnya: film 2012) tentang badai raksasa matahari, tidak akan terjadi dalam waktu dekat.

Seiring dengan perkembangan teknologi elektronika, serta kaitannya dengan iklim, studi tentang aktivitas matahari menjadi perhatian yang semakin perlu dikaji. Bisakah kita memprediksi badai matahari? Dinamika siklusnya? Dinamika cuaca antariksa yang di dorong dinamika matahari? Pengamatan matahari saat ini telah menggunakan teknologi satelit dalam menentukan bilamanakah terjadi aktivitas yang tiba-tiba dari matahari.

SOHO (Solar Heliospheric Observatory), diluncurkan untuk terus menerus memonitor matahari; ACE (Advance Composition Explorer), mengamati perubahan lingkungan antariksa dan memberikan peringatan adanya badai matahari, satu jam sebelum mencapai bumi. WIND yang mengawasi angin matahari yang terjadi pada ruang antar planet sekitar bumi, atau IMAGE (Imager for Magnetopause-to-Auroral Global Exploration) mengamati partikel bermuatan dan atom netral disekitar magnetosfer. Kesemuanya itu digunakan untuk memahami fenomena yang terjadi pada matahari dan keterkaitannya dengan lingkungan bumi. Tetapi pemahaman yang lebih baik lagi akan diperoleh jika kita bisa memahami bagaimana dinamika yang sesungguhnya terjadi jauh di dalam matahari, dan mendorong terjadinya dinamika yang teramati. Dan dengan dukungan pengamatan yang semakin baik, kajian yang semakin mendalam mendorong semakin berkembangnya studi bidang astronomi, khusunya astrofisika bintang/matahari. (Gambar dari SOHO ditampilkan pula di dalam blog ini, di bagian kanan)

Sumber: www.langitselatan.com

Tuesday, February 9, 2010

Where did today’s spiral galaxies come from?


Hubble shows that the beautiful spirals galaxies of the modern Universe were the ugly ducklings of six billion years ago.

If confirmed, the finding highlights the importance to many galaxies of collisions and mergers in the recent past. It also provides clues for the unique status of our own galaxy, the Milky Way. Using data from the NASA/ESA Hubble Space Telescope, astronomers have created a census of galaxy types and shapes from a time before Earth and the Sun existed, up to the present day. The results show that, contrary to contemporary thought, more than half of the present-day spiral galaxies had peculiar shapes as recently as 6 billion years ago.


The study of the shapes and formation of galaxies, known as morphology, is a critical and much-debated topic in astronomy. An important tool for this is the ‘Hubble sequence’ or the ‘Hubble tuning-fork diagram’, a classification scheme invented in 1926 by the same Edwin Hubble in whose honour the space telescope is named.

Hubble’s scheme divides regular galaxies into three broad classes — ellipticals, lenticulars and spirals — based on their visual appearance. A fourth class contains galaxies with an irregular appearance.

A team of European astronomers led by François Hammer of the Observatoire de Paris has, for the first time, completed a census of galaxy types at two different points in the Universe’s history — in effect, creating two Hubble sequences — that help explain how galaxies form. In this survey, researchers sampled 116 local galaxies and 148 distant galaxies.

The astronomers show that the Hubble sequence six billion years ago was very different from the one that astronomers see today. “Six billion years ago, there were many more peculiar galaxies than now – a very surprising result,” says Rodney Delgado-Serrano, lead author of the related paper recently published in Astronomy & Astrophysics. “This means that in the last six billion years, these peculiar galaxies must have become normal spirals, giving us a more dramatic picture of the recent Universe than we had before.” The astronomers think that these peculiar galaxies did indeed become spirals through collisions and merging. Although it was commonly believed that galaxy mergers decreased significantly eight billion years ago, the new result implies that mergers were still occurring frequently after that time — up to as recently as four billion years ago. “Our aim was to find a scenario that would connect the current picture of the Universe with the morphologies of distant, older galaxies — to find the right fit for this puzzling view of galaxy evolution,” says Hammer.

Also contrary to the widely held opinion that galaxy mergers result in the formation of elliptical galaxies, Hammer and his team support a scenario in which these cosmic clashes result in spiral galaxies. In a parallel paper published in Astronomy & Astrophysics, they delve further into their ‘spiral rebuilding’ hypothesis, which proposes that peculiar galaxies affected by gas-rich mergers are slowly reborn as giant spirals with discs and central bulges. Although our own Galaxy is a spiral galaxy, it seems to have been spared much of the drama; its formation history has been rather quiet and it has avoided violent collisions in astronomically recent times. However, the large Andromeda Galaxy from our neighbourhood has not been so lucky and fits well into the ‘spiral rebuilding’ scenario. Researchers continue to seek explanations for this.

Notes for editors:

The Hubble Space Telescope is a project of international cooperation between ESA and NASA.

Hammer and his team used data from the Sloan Digital Sky Survey undertaken by Apache Point Observatory, New Mexico, USA, and from the GOODS field and Hubble Ultra Deep Field taken by the Advanced Camera for Surveys aboard Hubble.

R. Delgado-Serrano, et al., 2010, How was the Hubble Sequence 6 Giga-years ago? Astronomy & Astrophysics, 509, A78.

F. Hammer et al., 2009, The Hubble Sequence: just a vestige of merger events? Astronomy & Astrophysics, 507, 1313.

Source: ESA

Thursday, January 21, 2010

The Known Universe


What would it look like to travel across the known universe? To help humanity visualize this, the American Museum of Natural History has produced a modern movie featuring many visual highlights of such a trip. The video starts in Earth's Himalayan Mountains and then dramatically zooms out, showing the orbits of Earth's satellites, the Sun, the Solar System, the extent of humanities first radio signals, the Milky Way Galaxy, galaxies nearby, distant galaxies, and quasars. As the distant surface of the microwave background is finally reached, radiation is depicted that was emitted billions of light years away and less than one million years after the Big Bang. Frequently using the Digital Universe Atlas, every object in the video has been rendered to scale given the best scientific research in 2009, when the video was produced. The film has similarities to the famous Powers of Ten video that has been a favorite of many space enthusiasts for a generation.


Source: APOD

Monday, January 18, 2010

Astronomy Without A Telescope – Getting Orientated


Artikel berikut mengenai bagaimana memperkenalkan astronomi kepada orang lain yang "buta" astronomi. Sumber: universetoday.

We’ve all been there. You’ve met someone nice – but for some inexplicable reason, they don’t get astronomy. So how do you start gently introducing them to your life’s passion (about astronomy that is) without scaring them away?

First it’s important to recognize that not everyone will be instantly in awe to learn you own a 14-inch Schmidt-Cassegrain with four speed microslew. Weird, but there it is. And it’s going to be a challenge getting that special someone to drive out to a lonely spot in the wilderness for some proper dark sky viewing – and don’t even mention that there’s such a thing as naked eye astronomy.

Start with the Sun – it’s big and it’s obvious and everyone gets that it rises in the east and sets in the west. Well, that of course means that the Earth is actually spinning from west to east. And heck, you’re an astronomer, so you’re bound to know your cardinal directions on familiar ground – so just point. We are spinning that way.

And if you are in the right part of the lunar cycle – you might comment, on one of those romantic moonlit evenings, that last night at this time the Moon was there – and tonight it’s shifted a bit to the east. Don’t dwell on it – just put the idea out there. The next night let them note that – hey, it’s moved even further east! They might even notice that it’s filled out a bit – but this is not the time to introduce them to the word gibbous.

What’s happening is that they are starting to make their own astronomical observations. All you have to do is to find an opportune moment to pull the background together. If the Earth spinning from west to east, that means that from a perspective in space – at least from above the North Pole – it’s spinning anti-clockwise. And the fact that the Moon inches further towards the east day by day means it’s orbiting the Earth anti-clockwise.

Hopefully you’ve captured their interest enough to carry on with the fact that actually all the planets orbit the Sun in that same anticlockwise direction – indeed, even the Sun spins in that same direction, once every 28 days. A quick mention of the theory that the whole solar system formed from a gas cloud that spun down into a disk – and it’s probably time to move on to another conservation topic. This is not the time to introduce them to the conservation of angular momentum. Pace yourself.


From here – a wealth of discussion could arise in the days to come. Your potential new partner might ponder whether all the planets spin in the same direction – to which you can reply well mostly, except for Venus and Uranus – and then you’re away talking about planetary collisions. Or, maybe you’ll be asked whether all the planet’s moons orbit in the same direction – to which you can reply well mostly, but there’s Triton that goes the wrong way around Neptune – probably because it came in from the Kuiper Belt. There’s a Kuiper Belt now?

Tuesday, January 12, 2010

Sense of Scale: Star's Size

Sumber: wikipedia

Wednesday, December 16, 2009

Astrofotografi - The Atmosphere and Observing

Tahukah Anda dengan istilah "seeing" atau sering diterjemahkan dengan istilah penampakan. Istilah ini sering membingungkan orang awam karena kata penampakan sering digunakan untuk konteks lainnya. Dalam astronomi, seeing (atau penampakan) merupakan ukuran baik tidaknya kondisi langit (tepatnya atmosfer) untuk mendapatkan hasil pengamatan yang baik. Seeing yang jelek terjadi jika atmosfer sedang dalam kondisi bergejolak. Hal ini akan membuat bintang nampak berkelap kelip dan akan nampak buram ketika difoto. Tentunya hal ini akan mengganggu pengamatan oleh astronom. Penjelasan lebih lengkapnya diberikan di bawah ini.

Introduction
An observer, be they at a mountain top observatory, or in their own back yard must, at all times contend with the Earth’s atmosphere. It is a notoriously unpredictable and limiting factor in obtaining fine views of the Planets, and close binary stars. Many often comment, especially here in the UK that seeing is all too often mediocre on most nights, but what are the factors that contribute to this?. Are there ways and signs, which indicate whether the atmosphere, will be stable or turbulent on a given night?.

What is Seeing?
So what exactly is atmospheric seeing? - it is high frequency temperature fluctuations of the atmosphere, and the mixing of air “parcels” of different temperatures/densities. This behaviour of the atmosphere is seen at the eyepiece as a blurred, moving, or scintillating image. There are roughly 3 main areas where Atmospheric turbulence occurs. Near ground seeing (0 – 100metres or so.) central troposphere (100m – 2km), and High troposphere (6-12km.) Each area exhibits different characteristics, which are explained in more detail below.
  • Lower Altitude Effects: The air near the ground is where the great majority of turbulent airflow of the atmosphere occurs, which of course happens to be the area where the great majority of amateur observers are located!. This is caused mainly by areas (houses, other building etc) of varying density radiating heat differently, resulting in local convection currents. This is caused when the Sun heats the ground during the day, and the heat is then radiated away at night. An un-varying topography, such as grassy fields, and large bodies of water are favourable to observe over, at they radiate the stored heat from the day more slowly and equally. Also the telescope itself can perturb the image, if it hasn’t reached ambient temperature, this will result in a “boiling effect” when viewing. One should leave their scope for at least 1 hr prior to observing and probably longer. Also certain types of telescope and observatory are more prone to turbulence. Newtonian reflectors can be troublesome if not properly ventilated, as can Schmidt Cassegrain’s if not left to cool for long enough. As for observatories, Domes have poorer characteristics for stable seeing than run of roof designs.
  • Mid- Altitude Effects: The turbulence at these altitudes is determined largely by the topography upwind of the observing site. Hence again, living downwind of a large city, or densely populated area, mountain range or other very varied topography will perturb the atmosphere. Downwind of a mountain peak will disrupt the airflow into turbulent eddies, resulting in scintillating images. This effect can prevail as far as 100km downwind of the peak. In this aspect, it is best to observe where the prevailing winds across your site have travelled over an unvarying terrain (large body of water or hills/fields for many miles upwind of the site.) This will help produce a laminar flow, and stable images.
  • High Altitude Effects: Effects at this altitude are caused by fast moving “rivers” of air know as Jet streams. Wind shears at around the 200-300mb altitude level can cause images to appear stable, but very fuzzy, and devoid of fine detail. There isn’t anything the observer can do to prevent these effects, but forecasts are available, to help predict weather a Jet stream is present over your area. Areas of the Northern hemisphere most affected by the Polar jet stream are the Central US, Canada, North Africa, and Northern Japan. The Jet stream’s position varies with the seasons, tending to move further South during the winter and spring months.
The best locations for good seeing
The world’s finest locations for a stable atmosphere are mountain top observatories, located above frequently occurring temperature inversion layers, where the prevailing winds have crossed many miles of ocean. Sites such as these (La Palma, Tenerife, Hawaii, Paranal etc) frequently enjoy superb seeing much of the year, (with measured turbulence as low as 0.11” arc seconds occurring at times) due to a laminar flow off the ocean. Sea level locations, on shorelines, where the prevailing winds have crossed many miles of ocean (Florida, Caribbean Islands, Canary Islands etc) can be almost as good, and generally very consistent and stable conditions prevail there. Also a major factor is generally unvarying weather patterns, dominated by large anti-cyclones (High pressure systems.) Areas outside these large high-pressure systems have more variable weather, and are more prone to a more variable state of atmospheric stability.

Other, less well know locations where excellent stability prevails are the Island of Madeira’s highest point (Encumeada Alta, 1800m) where seeing is better than 1” arc second 50% of the time. At Mount Maidanak (Uzbekistan, 2600m) the median seeing value observed from 1996-2000 was just 0.69” arc seconds, presenting a site with properties almost as good as Paranal and La Palma.

Figure 01: Above are the observatories (Left) Roque De Los Muchachos on La Palma, and (Right) Observatorio del Teide on Tenerife. Both are located at 2400m above sea level, and are among the worlds finest observing locations. Measured turbulence values at these locations is better than 1” arc second a staggering 80% of the year. (Courtesy ENO.)

Figure 02: Above is a diagram showing how mountains break up stable airflow into turbulence. Note the difference in the probable views from site A (facing into the prevailing winds off the ocean) and site B (Located on the downwind side of the mountain peaks.)

Predicting your local seeing
So is it possible to predict Atmospheric seeing with any accuracy?. The answer to this is yes, most of the time. For example poor seeing will almost always occur after a cold front has passed over, replacing the warmer air, with cooler air, which often gives rise to local convection, and turbulent skies. However, preceding a cold front the air is warmer, and more stable. This is especially true when a large High-pressure system has been present, and mist or fog forms. At these times, transparency can be reduced, but seeing can be excellent. It is also my experience that strong winds are often associated with poor seeing. Another thing to look out for is what type of clouds are present. Lots of cumulus forming in the afternoon due to convection will probably mean seeing will be poor for several hours after sunset. However if the winds are light, and high altitude cirrus shows a smooth linear pattern, this often indicates that the seeing will be good. It was also once thought that maritime locations were far from optimal for good seeing conditions, but as we have seen earlier in the article this is often far from the case.

An even easier way to quickly gauge if a given night will present fine telescopic views is to simply see how much the stars are twinkling. If they twinkle little, and slowly, it probably indicates seeing conditions are reasonably good. However, if they are twinkling madly its probably a sign the views will be poor. This basic method does work quite well, but isn’t 100% accurate. Nights when fast, high altitude turbulence prevails will not show itself as noticeable twinkling, and one must simply look through their telescope to see what’s happening.

Figure 03: Above is a diagram showing a cold front, and associated air masses. The air preceding the front is older, and warmer, and generally quite stable as the ground/air temperature difference is small. However, after the front passes, the warmer air is replaced by cooler air, resulting in significant local convection causing turbulence. Seeing wont improve until the ground/air temperatures again equalize – this usually takes several hours.

A scale of seeing
Many scales have been devised to rate how steady the atmosphere is on a given night. Below is one of the most popular in use, and one I personally use. This scale of seeing is the Pickering Scale, devised by Harvard Observatory's William H. Pickering (1858-1938). Pickering used a 5-inch refractor to devise the scale. His comments about diffraction patterns will have to be modified for larger or smaller instruments. A good starting point:

p1. Star image is usually about twice the diameter of the third diffraction ring if the ring could be seen; star image 13" in diameter.

p2. Image occasionally twice the diameter of the third ring (13").

p3. Image about the same diameter as the third ring (6.7"), and brighter at the centre.

p4. The central Airy diffraction disk often visible; arcs of diffraction rings sometimes seen on brighter stars.

p5. Airy disk always visible; arcs frequently seen on brighter stars.

p6. Airy disk always visible; short arcs constantly seen.

p7. Disk sometimes sharply defined; diffraction rings seen as long arcs or complete circles.

p8. Disk always sharply defined rings seen as long arcs or complete circles, but always in motion.

p9. The inner diffraction ring is stationary. Outer rings momentarily stationary.

p10. The complete diffraction pattern is stationary.

Note: On this scale 1-2 is very poor, 3-4 is poor, 5 is fair, 6-7 is good, 7-8 very good, and 8-10 excellent.

Fig 04. A drawing of Jupiter by the author, simulated to show 3 different views as a high quality 25 cm reflector would show the Planet at powers of 350x. (far left) under excellent seeing, (centre) under fair seeing, and (far right) very poor seeing.

Source: The Atmosphere and Observing by Damien Peach

Sunday, December 6, 2009

Basic Astronomy: Phases of The Moon

Moon phases, or lunar phases, refer to the different appearances that the Moon takes on over the course of a lunar month. At the beginning of a lunar month, the Moon is dark. And then, over the course of the month, more and more of the Moon is illuminated until we see a full moon. Then the amount of illuminated moon decreases to a new moon again. Then the cycle starts all over again. These are the phases of the Moon.

When thinking about what causes the phases of the Moon, you've got to realize that the Moon is always half illuminated by the Sun. This is the same for all the objects in the Solar System. We see the different moon phases from here on Earth because our perspective of the Moon changes as it orbits around the Earth. When we can see the Moon fully illuminated, then the Sun and Moon are on opposite sides of the Earth; this is a full moon. The situation is reversed when the Moon and the Sun are on the same side of the Earth. This is when we see a new moon. The other lunar moon phases occur when the Moon makes various angles compared to the Earth.

Eight Phases of the Moon
Although the lunar phases actually transition smoothly from one phase to another, we have developed different terms for the 8 moon phases that look distinct. The Moon's appearance moves through each of these moon phases as the amount of sunlight falling on it changes from our perspective. this is a cycle that always moves in the same direction. The Moon will always go from new moon to first quarter then full moon, then last quarter and back to new moon again.

Here are the eight phases of the moon:

  1. New Moon – When the illuminated side of the Moon is away from the Earth. The Moon and the Sun are lined up on the same side of the Earth, so we can only see the shadowed side. This is also the time that you can experience solar eclipses, when the Moon passes directly in front of the Sun and casts a shadow onto the surface of the Earth. During a new moon, we can also see the reflected light from the Earth, since no sunlight is falling on the Moon – this is known as earthshine.
  2. Crescent – The crescent moon is the first sliver of the Moon that we can see. From the northern hemisphere, the crescent moon has the illuminated edge of the Moon on the right. This situation is reversed for the southern hemisphere.
  3. First Quarter – Although it's called a quarter moon, we actually see this phase when the Moon is half illuminated. This means that the Sun and the Moon make a 90-degree angle compared to the Earth.
  4. Waxing Gibbous – This phase of the Moon occurs when the Moon is more illuminated that half, but it's not yet a full Moon.
  5. Full Moon – This is the phase when the Moon is brightest in the sky. From our perspective here on Earth, the Moon is fully illuminated by the light of the Sun. This is also the time of the lunar month when you can see lunar eclipses – these occur when the Moon passes through the shadow of the Earth.
  6. Waning Gibbous – In this lunar phase, the Moon is less than fully illuminated, but more than half.
  7. Last Quarter – At this point of the lunar cycle, the Moon has reached half illumination. Now it's the left-hand side of the Moon that's illuminated, and the right-hand side in darkness (from a northern hemisphere perspective).
  8. Crescent – This is the final sliver of illuminated moon we can see before the Moon goes into darkness again.
And so, the Moon passes through each of these phases each lunar month. It takes a total of 29.53 days to go from new moon to new moon.

Source: universe today

Saturday, December 5, 2009

How Galaxies Lose Their Gas

As galaxies evolve, many lose their gas. But how they do this is a point of contention. One possibility is that it is used to form stars when the galaxies undergo intense periods of star formation known as starburst. Another is that when large galaxies collide, the stars pass through one another but the gas gets left behind. It's also possible that the gas is pulled out in close passes to other galaxies through tidal forces. Yet another possibility involves a wind blowing the gas out as galaxies plunge through the thin intergalactic medium in clusters through a process known as ram pressure.

A new paper lends fresh evidence to one of these hypotheses. In this paper, astronomers from the University of Arizona were interested in galaxies that displayed long gas tails, much like a comet. Earlier studies had found such galaxies, but it was unclear whether or not this gas tail was pulled out from tidal forces, or pushed out from ram pressure.

To help determine the cause of this the team used new observations from Spitzer to look for subtle differences in the causes of a tail following the galaxy ESO 137-001. In cases where tails are known to be pulled out tidally (such as in the M81/M82 system), there "is no physical reason why the gas would be preferentially stripped over stars." Stars from the galaxy are pulled out as well and often large amounts of new star formation are induced. Meanwhile, ram pressure tails should be largely free of stars although some new star formation may be expected if there is turbulence in the tail which causes regions of higher density (think like the wake of a boat).

Examining the tail spectroscopically, the team was unable to detect the presence of large numbers of stars suggesting tidal processes were not responsible. Furthermore, the disk of the galaxy seemed relatively undisturbed by gravitational interactions. To support this, the team calculated the relative strengths of the forces acting on the galaxy. They found that, between the tidal forces acting on the galaxy from its parent cluster, and its own centripetal forces, the internal forces where greater, which reaffirmed that tidal forces were an unlikely cause for the tail.

But to confirm that ram pressure was truly responsible, the astronomers looked at other parameters. First they estimated the gravitational force for the galaxy. In order to strip the gas, the force generated by the ram pressure would have to exceed the gravitational one. The energy imparted on the gas would then be measurable as a temperature in the gas tail which could be compared to the expected values. When this was observed, they found that the temperature was consistent with what would be necessary for ram stripping.

From this, they also set limits on how long gas could last in such a galaxy. They determined that in such circumstances, the gas would be entirely stripped from a galaxy in ~500 million to 1 billion years. However, because the density of the gas through which the galaxy would slowly become denser as it passed through the more central regions of the cluster, they suggest the timescale would be much simpler. While this timescale say seem long, it is still shorter than the time it takes such galaxies to make a full orbit in their cluster. As such, it is possible that even in one pass, a galaxy may lose its gas.

If the gas loss occurs on such short timescales, this would further predict that tails like the one observed for ESO 137-001 should be rare. The authors note that an “X-ray survey of 25 nearby hot clusters only discovered 2 galaxies with X-ray tails.”

Although this new study in no way rules out other methods of removing a galaxy's gas, this is one of the first galaxies for which the ram stripping method is conclusively demonstrated.

Source: universe today
Original source: A Warm Molecular Hydrogen Tail Due to Ram Pressure Stripping of a Cluster Galaxy

Monday, November 23, 2009

More on Leonid Meteor Shower 2009


The year 2009 will not see a Leonid storm, but an outburst for sure. There are still some uncertainties regarding the time of maximum of the 1466 trail. For those of you seeking a definitive date and time, it isn't always possible, but we can learn a whole lot about when and where to look.
The Leonid Meteor Shower belongs to the debris shed by comet 55/P Tempel-Tuttle as it passes our Sun in its 33.2 year orbit. Although it was once assumed it would simply be about 33 years between the heaviest "showers," we later came to realize the debris formed a cloud which lagged behind the comet and dispersed irregularly. With each successive pass of Tempel-Tuttle, new filaments of debris are left in space along with the old ones, creating different "streams" the orbiting Earth passes through at varying times, which makes blanket predictions unreliable at best. Each year during November, we pass through the filaments of its debris – both old and new ones – and the chances of impacting a particular stream from any one particular year of Tempel-Tuttle's orbit becomes a matter of mathematical estimates. We know when it passed… We know where it passed. But will we encounter it and to what degree? Traditional dates for the peak of the Leonid meteor shower occur as early as the morning of November 17 and as late as November 19.

So what can we expect this year? According to NASA's 2009 predictions a significant shower is expected this year when Earth crosses the 1466-dust and 1533-dust ejecta of comet 55P/Tempel-Tuttle. According to J. Vaubaillon, the narrow (about 1-hr) shower is expected to peak on November 17, 2009, at 21:43 (1466) and 21:50 (1533) UT, perhaps 0.5 to 1.0 hour later based on a mis-match in 2008, with rates peaking at about ZHR = 115 + 80 = 195/hr (scaled to rates observed in 2008). E. Lyytinen, M. Maslov, D. Moser, and M. Sato all predict similar activity from both trails, combining to about ZHR = 150 – 300 /hr. P. Jenniskens notes that if the calculated trail pattern is slightly shifted in the same manner as observed before, then the 1533-dust trail would move in Earth's path and its rates would be higher (the 1466-dust trail would move away). However, the 1533-dust trail is distorted in the models, and because of that it is not clear how much higher that would be. This remains a rare opportunity to study old dust trails from comet 55P/Tempel-Tuttle. In such old trails, the model of Lyytinen and Nissinen predicts wide trails, which can be tested by measuring the width of the outburst profile.
Let's take a closer look at the at how the two centuries old trails will affect our observing, beginning with the one created in the year 1466. The exact same trail will be encountered again this year with its maximum rate of up to 115 meteors per hour occurring at 21:43 UT (may be 0.5-1hr later). "The trail will be much closer to the Earth, explaining why we expect a quite high zenith hourly rate." say J. Vaubaillon (et al), "However the discrepancy between the expected time of maximum remains, as well as a general higher expected ZHR. Among the possible explanations are: sensitivity to initial conditions (given that the trail is 16 Rev. old) or change of cometary activity (impossible to verify unfortunately)."
But don't count on only this single trail, because the year 1533 trail will encounter the Earth at almost the same time as the 1466 trail. Its maximum time of arrival is expected to be at 21:50 UT on the 17th of November, with a zenith hourly rate of 80 – for a combined rate of perhaps 200 meteors per hour. "The total level of the shower (ZHR~200/hr) was callibrated using the 2008 observations of the 1466 trail, but nothing is known from the 1533 trail. As a consequence, it will be very interesting to check." comments Vaubaillon, "In particular there might be a difference of up to 1 hour between the 1466 and 1533 trail, or they might even be late together, giving us some insight about how well/poorly we know comet 55P's orbit."

Let's take a closer look with 3D-view of the two trails may have evolved between 1466 and 2009.


Dr. Vaubaillon's colleagues from MSFC (D. Moser and B. Cooke) pointed out that the best location to view the outburst caused by the 1466 and 1533 trails will be centered around India and includes: Nepal, Thailand, Western China, Tadjikistan, Afghanistan, Eastern Iran, South Central Russia, etc. Dr. P. Atreya (IMCCE), citizen of Nepal, is currently organizing an international Leonid observation campaign in his home country. This campaign will involve many amateurs and researchers from Nepal and other countries. The climate conditions in Nepal at this time of the year makes it an excellent spot.

We may never know precisely where and when the Leonids might strike, but we do know that a good time to look for this activity is well before dawn on November 17, 18 and 19. Where do you look? For most of us, the best position will be to face east and look overhead.

Source: Universe today

A trivia question:
Can you calculate how thick the meteor cloud based on information given?